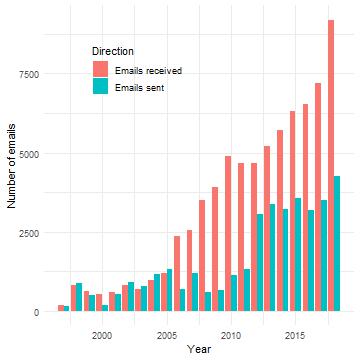
As the year is closing down, why not spend some of the free time to explore your email data using R and the tidyverse? When I learned that Mac OS Mail stores its internal data in a SQLite database file I was hooked. A quick dive in your email archive might uncover some of your old acquaintances. Let’s take a peak.

Continue reading

Exploratory data analysis is important, everybody knows that. With R, it is also easy. Below you will see three lines of code that allow you to interactively explore the Preston Curve, the prominent association of country level real income per capita with life expectancy.

Continue reading

The awesome blog post by Tyler Morgan-Wall on 3d printing maps with his rayshader package rekindled an old desire of mine: Sometimes I would like to touch data. I am a big fan of data visualization and being able to add a third dimension and this haptic feel to the mix was just too much for me to let this idea pass. While Tyler is keeping teasing us with references to an upcoming rayshader update that will allow the 3d mapping of ggplot output, I could not wait for this to hit GitHub.

Continue reading

Did you ever want to do a quick exploratory pass on a panel data set? Did you ever wish to give somebody (e.g., a reviewer or a fellow researcher), the opportunity to explore your data and your findings but can’t provide your raw data? Do you get bored from producing the same tables and figures over and over again for your panel data project? If your answer to one of the questions above is yes, then the new ExPanDaR R package might be worth a look.

Continue reading

Author's picture

Joachim Gassen

Curious researcher, passionate teacher and coding nerd.

Professor of accounting at Humboldt-Universität zu Berlin

Berlin