I recently included the new Our World in Data data on Covid-19 vaccination progress around the world in the {tidycovid19} package. What was meant to be a short info post for package users turned into a mini case on “outliers”. See for yourself
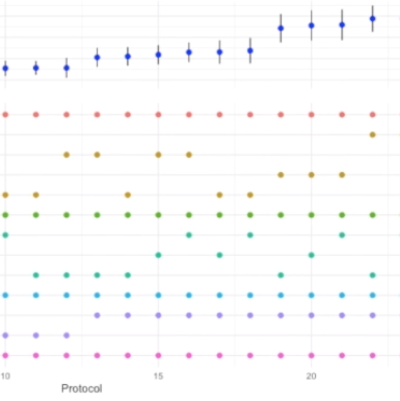
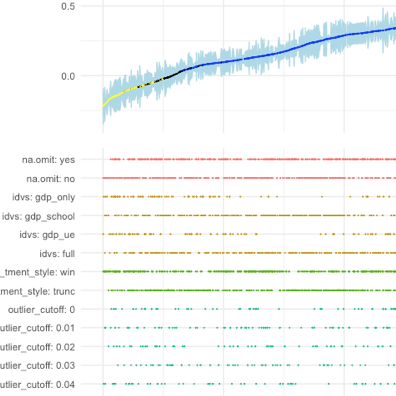
Online appendices detailing the robustness of empirical analyses are paramount but they never let readers explore all reasonable researcher degrees of freedom. Simonsohn, Simmons and Nelson suggest a ‘specification curve’ that allows readers to eyeball how the main coefficient of interest varies across a wide arrange of specifications. I build on this idea by making it interactive: A shiny-based web app enables readers to explore the robustness of findings in detail along the whole curve.
Following up on a recent blog article that discussed how to use R to explore your researcher degrees of freedom, this post introduces a specification curve plot as suggested in Simonsohn, Simmons and Nelson. With this plot, you can eyeball how various researcher degrees of freedom affect your main outcome of interest.
Researchers face many options when designing tests. The resulting researcher degrees of freedom are often not well documented in published work but highly influential for findings. My new in-development R package rdfanaylsis provides a coding framework to systematically document and explore the researcher degrees of freedom in research designs based on observational data.
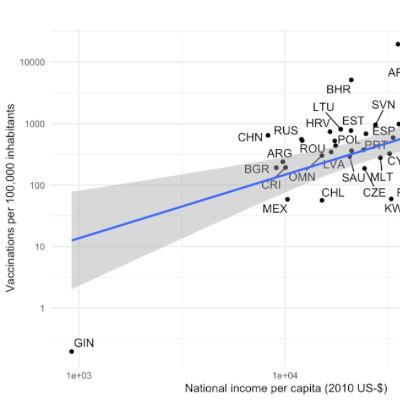
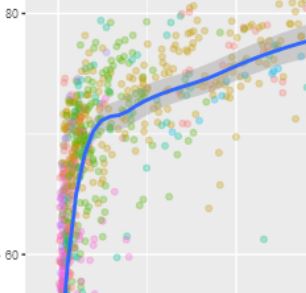
Exploratory data analysis is important, everybody knows that. With R, it is also easy. Below you will see three lines of code that allow you to interactively explore the Preston Curve, the prominent association of country level real income per capita with life expectancy.