This is a follow-up blog post to reflect that the Johns Hopkins CSSE team has just adjusted the time-series table structure in their github repository. Currently, they only seem to provide time series data on confirmed cases and deaths. The data of the old post is still available but won’t be updated.
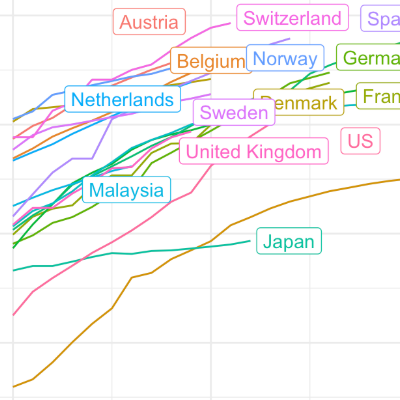
This short blog post presents code to tidy the Covid-19 case data provided by the Johns Hopkins University at the country level. I wrote the code for an R Tutorial that I am currently drafting for locked down students. I thought that I share the code snippet in case somebody wants to work with country level Covid-19 data, in particular by merging it with additional sources.
When starting a course you want to learn something about the background of your students. What do you do when the course is too large for an introduction round? Run a shiny survey!
Classroom experiments are a great way to communicate insights and shiny is a fantastic tool to develop interactive data displays. Linking the two together, you can build a unique experience for your students!