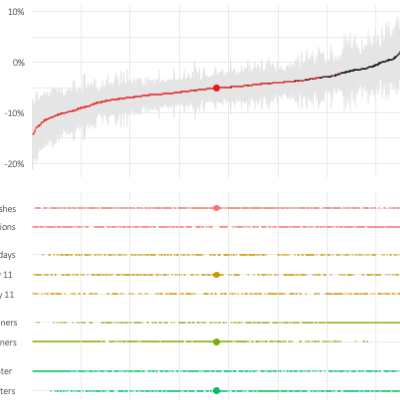
When preparing the analysis for our recent preregistered field experiment on the effect of carbon foodprint labels, we decided to implement an (interactive) specification curve analysis to present insights on how large our researcher degrees of freedom were, even after preregistration. This blog post introduces the idea and links you to the GitHub repo, where you can reproduce and explore our analyis relatively quickly using GitHub Codepaces.

