
Preregistration and Researcher Degrees of Freedom: Experiences from a Field Experiment
Designing research studies involves making choices. While some of these choices can be justified by theory, other choices will be more or less arbitrary and so the researcher has the freedom to choose, giving rise to the so-called researcher degrees of freedom phenomenon. While this is not a problem per se it becomes an issue as soon as the researcher is aware of the consequences of their choices for inference. Given the incentives in academia and personal priors, it seems likely that researchers might be tempted to make choices that create “desirable” or “expected” findings. The prominent problems of “p-hacking” and “HARKing” result.
Preregistering research designs is often viewed as a remedy to this problem. By specifying and publicly registering research designs and their according choices prior to collecting the data and running the analysis, researchers can effectively “tie their hands” as far as their degrees of freedom are concerned. What might be even better is that some journals allow such preregistrations to enter the review process as so-called registered reports. These reports are then be evaluated by the review process, potentially leading to improvements of the research design and eventually an in-principle acceptance. Such a process not only greatly reduces the risk of opportunistic exploitation of the researcher degrees of freedom. It also provides feedback to researches at the right point of time (i.e., when things still can be fixed). Finally, it avoids the risk that finalized studies do not get published simply because they fail to reject the null hypothesis.
But does it really avoid p-hacking? A maintained assumption is here that it is feasible to foresee and decide upon all potential design parameters of a project prior to preregistration. Building on our experience, I would like to argue that this is hardly possible, in particular in field settings. Also, there are situations where with the hindsight of having conducted the experiment, one would rather change some decisions that were taken during preregistration.
As an example: We (Bianca Beyer, Rico Chaskel, Simone Euler, Joachim Gassen, Ann-Kristin Großkopf, and Thorsten Sellhorn) recently conducted a large field experiment on carbon footprint labeling in a student canteen setting. When preregistering our experiment, we had to take various design choices. For many of those, we had to formulate expectations. For example, we had to predict the frequency and the within-day distribution of our daily diners based on historical data. Then, when we actually conducted the experiment, we were facing an unexpected record number of diners, leading our canteen operator to make some last minute changes to the daily menu plans. This presented us with both: new design choices (how should we deal with within-day changes in the menu plan) and with updated priors influencing choices that we already made (how to use day-time fixed effects to control changing diner density during the day).
As we were so fortunate to receive an in-principle acceptance of our preregistered report from the Journal of Accounting Research prior to running the experiment, we of course wanted to execute our preregistered research plan as literally as possible. Regardless, we needed to take these decisions that we could not foresee to even exist during the pre-registration process. And finally, regardless of the preregistration, we were interested in assessing the robustness of our findings. Maybe they were an artifact of our preregistered design choices (some of which were arguable more ad hoc than others).
This is why we decided to conduct a non-preregistered researcher degrees of freedom analysis and include specification curves for our main hypotheses in our paper. Specification curves are a great way to visualize how the inherent choice of a research design affect key research findings. Using the rdfanalysis package, these figures now allow us to summarize how robust our findings are.
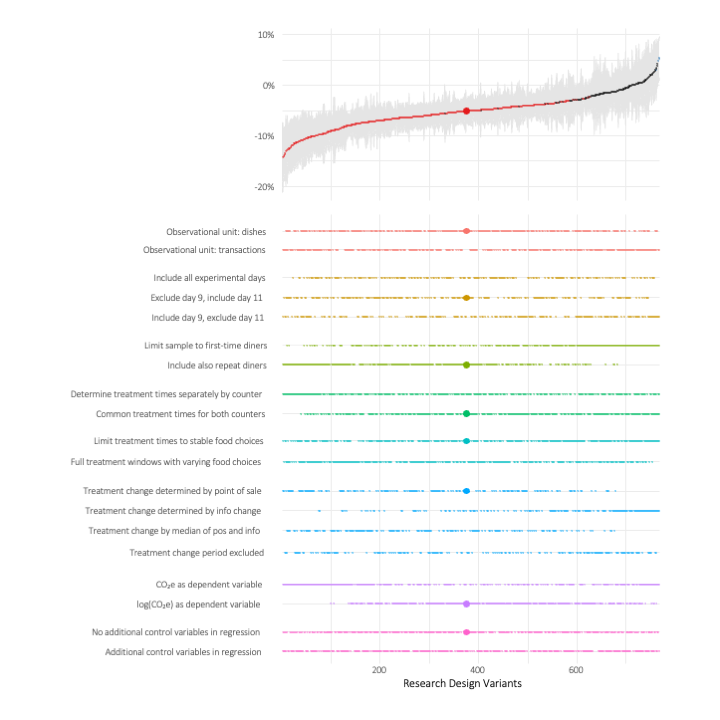
When you compare the results for our first hypotheses (H1, overall effect of carbon labeling on CO2e spent) with the results for the second (H2, effect of information contextualization), you can see a striking difference on the representativeness of our preregistered design for the universe of coefficients that one obtains when exhausting our key researcher degrees of freedom. While for H1, the large dot indicating our preregistered and reported effect seems to reflect the overall effect distribution very well, for H2, our effect estimate (which is insignificant in conventional terms for some of our outcome variables) is located in the upper tail of the effect distribution, meaning that it reflects an effect that is absolutely small compared to the main mass of effects.
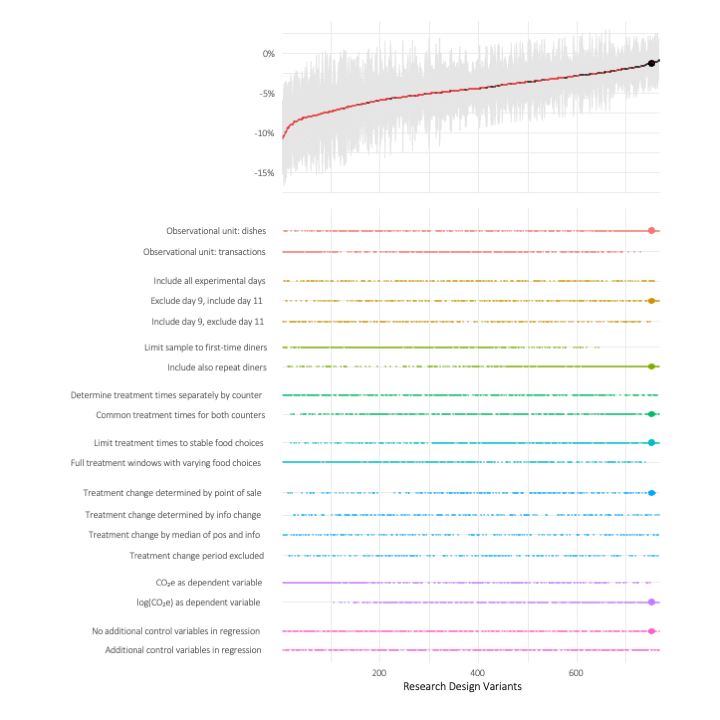
While the specification curves provide a very good first overview of the findings, using them to compare the outcomes of specific designs is not easy. To provide that option, we used another feature of the rdfanalysis package that allows to host dynamic specification curves as a web dashboard. Using this display, you have the option to drill down into the specific options that you are interested in. As the remaining design options are being reduced, the display will switch from plotting specification curves to a “traditional” regression table, allowing you to evaluate the designs that you are interested in in more depth.
As becomes apparent from the plots, researcher degrees of freedom seem to matter even in preregistered research settings, at least as long the designs are not situated in very tightly controlled lab settings. Specification curves visualizing the effect of both preregistered and post hoc choices can help to communicate the robustness of your research findings.
Do you want to take a peek under the hood of our analysis to explore our findings or the methodology for the specification curve analysis in more depth? Then go ahead and dive into our replication package. It is available on GitHub and also includes a development container. This means that if you have a GitHub account you can use GitHub codespaces (60 free two-core hours per month) to reproduce our analysis and start you own local dynamic specification curve in the browser. For a tutorial on how to do this, you can follow this youtube video!
Feel free to comment below and share your views. In any case: Thanks for reading and enjoy!
