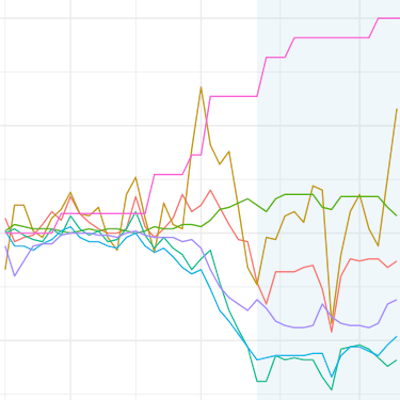
Yesterday, I came across the Google “COVID-19 Community Mobility Reports“. In these reports, Google provides some statistics about changes in mobility patterns across geographic regions and time. The data seem to be very interesting to assess the extent of how much governmental interventions and social incentives have affected our day-to-day behavior around the pandemic. Unfortunately, the data comes in by-country PDFs. What is even worse, the daily data is only included as line graphs in these PDFs. Well, who does not like a challenge if it is for the benefits of open science?
