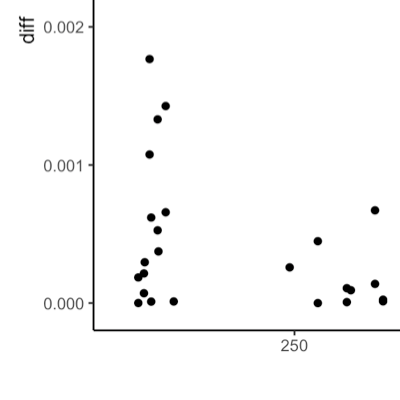
I had it on my long-term to-do list: Understanding how the standard errors that the Stata command ‘reghdfe’ generate differ from the standard errors that various R package for panel fixed effect models generate. Here is what I learned.
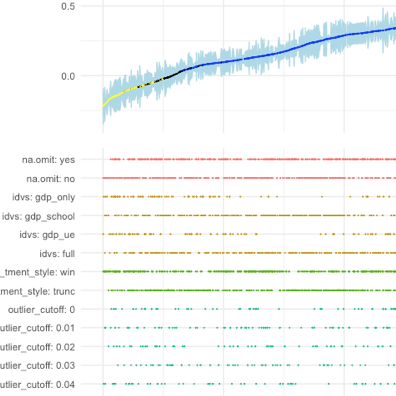
Online appendices detailing the robustness of empirical analyses are paramount but they never let readers explore all reasonable researcher degrees of freedom. Simonsohn, Simmons and Nelson suggest a ‘specification curve’ that allows readers to eyeball how the main coefficient of interest varies across a wide arrange of specifications. I build on this idea by making it interactive: A shiny-based web app enables readers to explore the robustness of findings in detail along the whole curve.
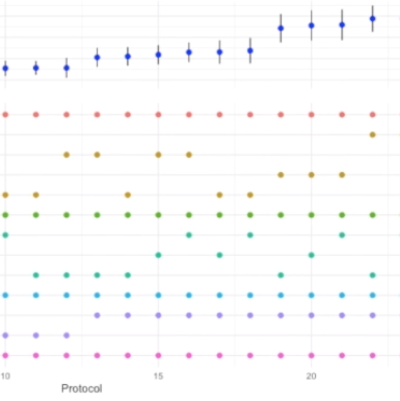
Following up on a recent blog article that discussed how to use R to explore your researcher degrees of freedom, this post introduces a specification curve plot as suggested in Simonsohn, Simmons and Nelson. With this plot, you can eyeball how various researcher degrees of freedom affect your main outcome of interest.
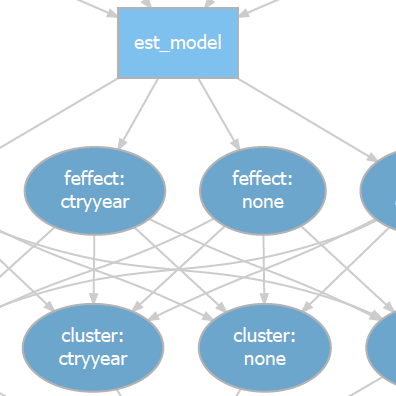
Researchers face many options when designing tests. The resulting researcher degrees of freedom are often not well documented in published work but highly influential for findings. My new in-development R package rdfanaylsis provides a coding framework to systematically document and explore the researcher degrees of freedom in research designs based on observational data.