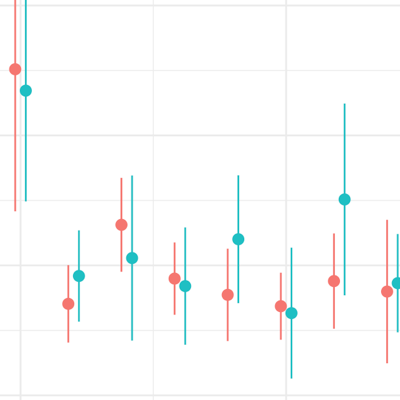
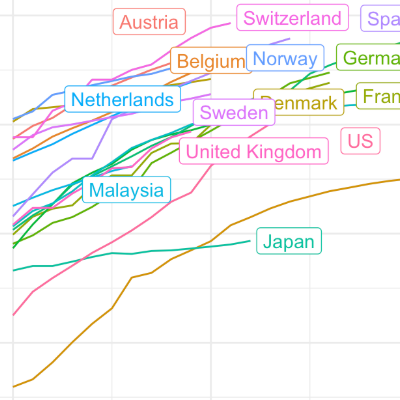
I have decided that the world needs another Covid-19 related R package. Not sure whether you agree, but the new package facilitates the direct download of various Covid-19 related data (including data on governmental measures) directly from authoritative sources. It also provides a flexible function and accompanying shiny app to visualize the spreading of the virus. Play around with the shiny app here if you like or hang around to learn more about the package.
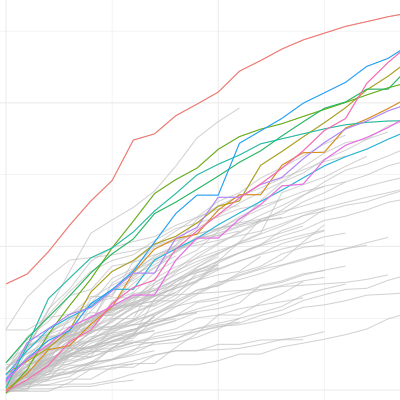
Following up on prior posts I now document on how to obtain and merge data on government measures (like social distancing measures or lockdown rules) provided by the Assessment Capacities Project (ACAPS) with the Covid-19 data from the Johns Hopkins CSSE team. In the longer run, this merged data can be used to study the impact of interventions on the global spread of the virus.
This is a follow-up blog post to reflect that the Johns Hopkins CSSE team has just adjusted the time-series table structure in their github repository. Currently, they only seem to provide time series data on confirmed cases and deaths. The data of the old post is still available but won’t be updated.
This short blog post presents code to tidy the Covid-19 case data provided by the Johns Hopkins University at the country level. I wrote the code for an R Tutorial that I am currently drafting for locked down students. I thought that I share the code snippet in case somebody wants to work with country level Covid-19 data, in particular by merging it with additional sources.