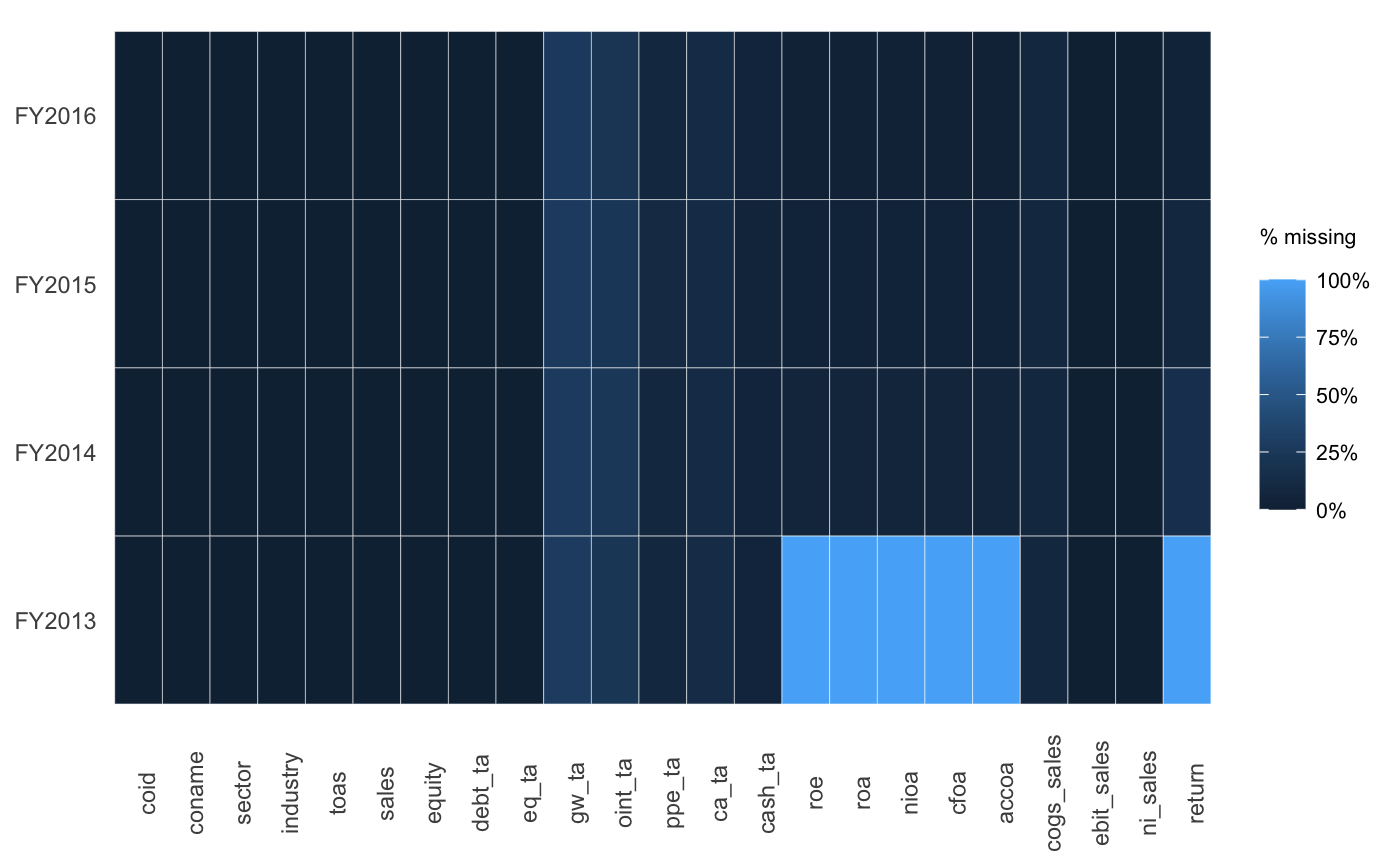
Prepares a Graph Displaying Missing Values in Panel Data
prepare_missing_values_graph.RdDisplays a heatmap of missing value frequency across the panel
prepare_missing_values_graph(df, ts_id, no_factors = FALSE, binary = FALSE)
Arguments
| df | Data frame containing the data. |
|---|---|
| ts_id | A string containing the name of the variable indicating the time dimension. Needs to be coercible into an ordered factor. |
| no_factors | A logical value indicating whether you want to limit the plot to
logical and numerical variables. Defaults to |
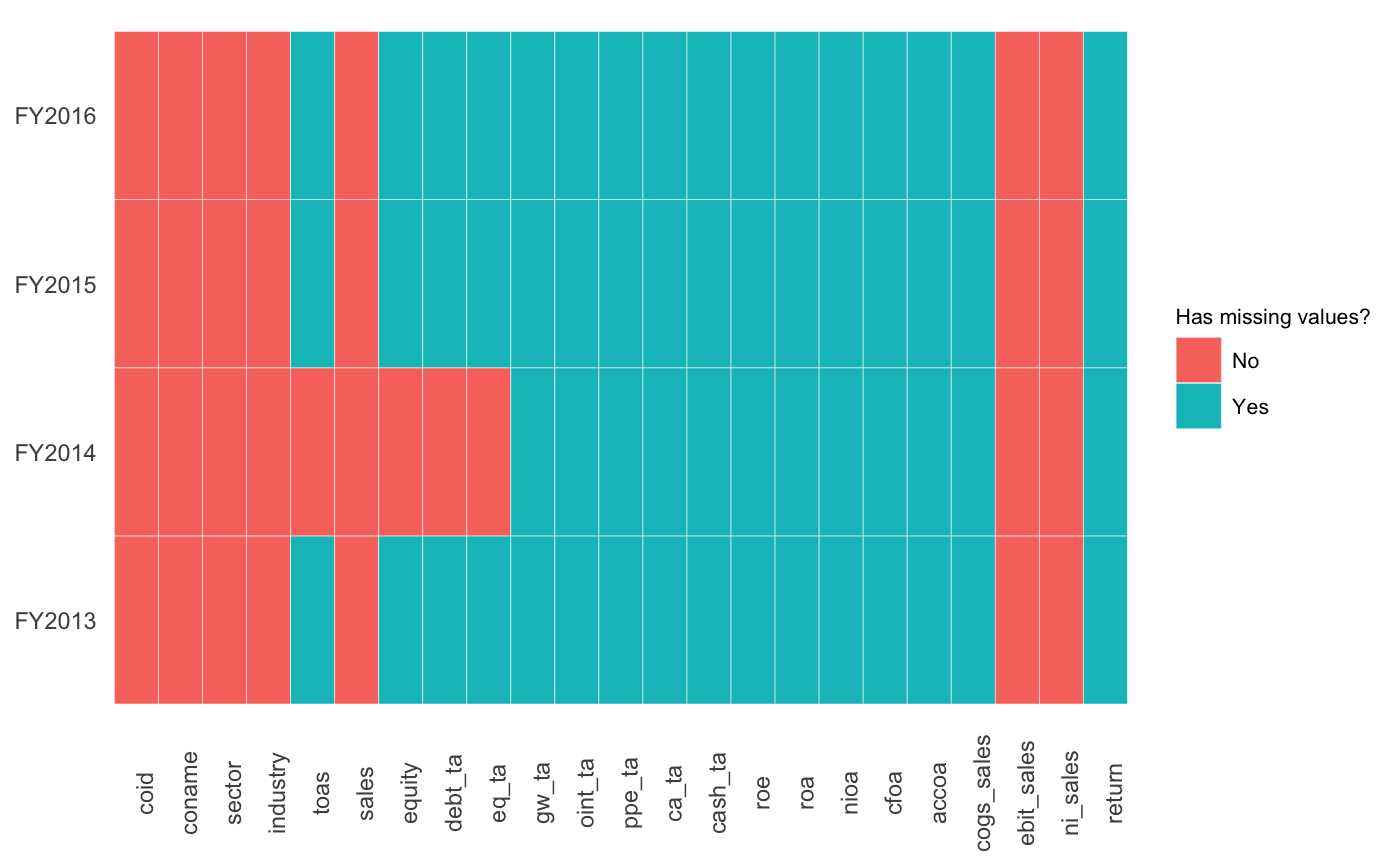
| binary | If set to |
Value
A ggplot2 plot.
Details
This was inspired by a blog post of Rense Nieuwenhuis. Thanks!
Examples
prepare_missing_values_graph(russell_3000, ts_id="period")prepare_missing_values_graph(russell_3000, ts_id="period", binary = TRUE)