Download Google Community Mobility Reports Data
download_google_cmr_data.RdDownloads Google Community Mobility Report data
(https://www.google.com/covid19/mobility/).
As stated on this webpage, the "reports chart movement trends over time
by geography, across different categories of places such as retail and
recreation, groceries and pharmacies, parks, transit stations,
workplaces, and residential". Google prepares these reports to help
interested parties to assess responses to social distancing guidance
related to Covid-19. As Google is no longer updating this data since
October 15, 2022 static historic is downloaded and calling the function
with cache = FALSE yields a warning.
download_google_cmr_data(type = "country", silent = FALSE, cached = FALSE)
Arguments
| type | The type of data that you want to retrieve. Can be any subset of
|
|---|---|
| silent | Whether you want the function to send some status messages to
the console. Might be informative as downloading will take some time
and thus defaults to |
| cached | Whether you want to download the cached version of the data
from the tidycovid19 Github repository instead of retrieving the
data from the authorative source. Downloading the cached version is
faster and the cache is updated daily. Defaults to |
Value
If only one type was selected, a data frame containing the
data. Otherwise, a list containing the desired data frames ordered as
in type.
Examples
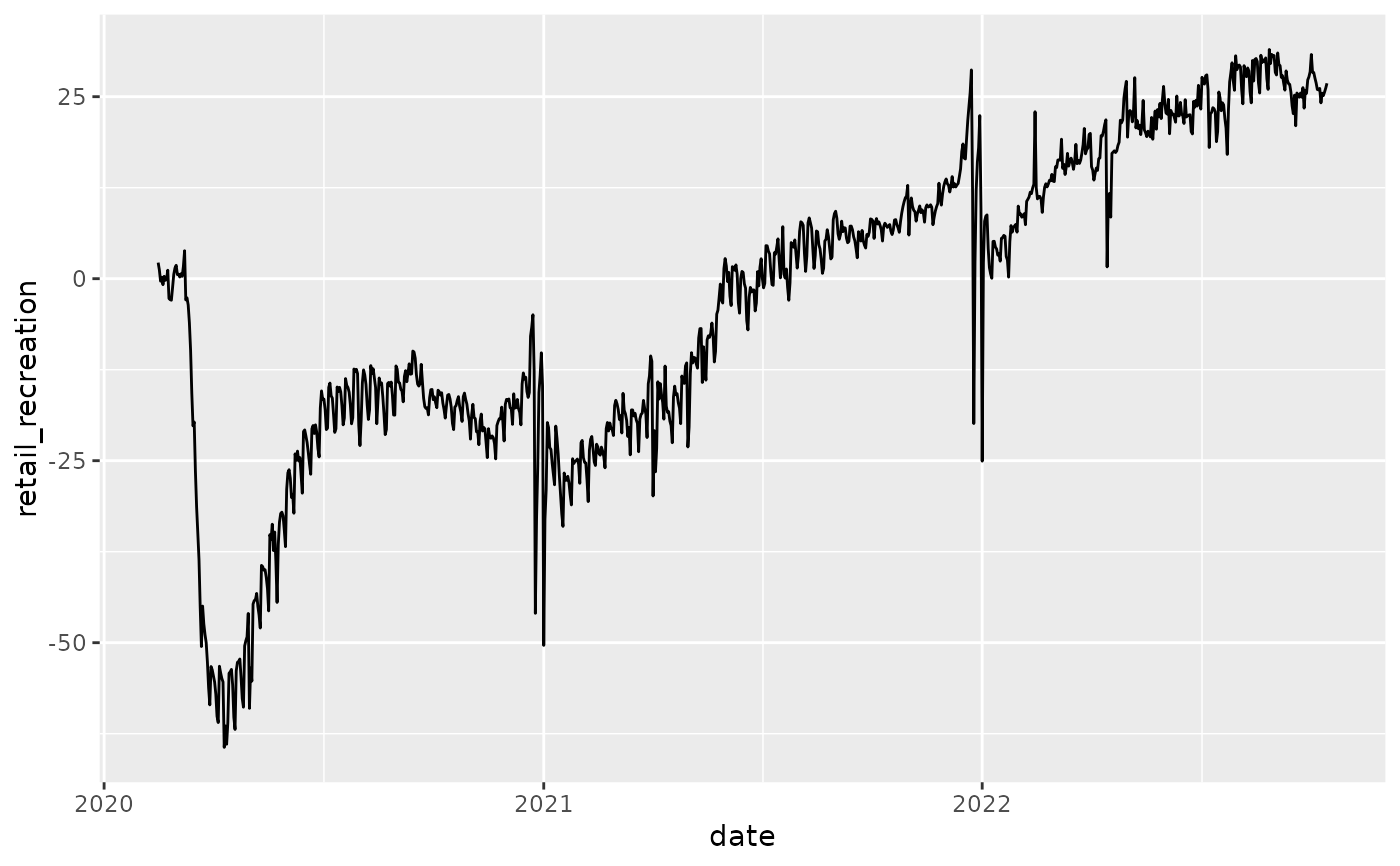
df <- download_google_cmr_data(silent = TRUE, cached = TRUE) df %>% dplyr::group_by(date) %>% dplyr::summarize( retail_recreation = mean(retail_recreation, na.rm = TRUE) ) %>% ggplot2::ggplot(ggplot2::aes(x = date, y = retail_recreation)) + ggplot2::geom_line()df <- download_google_cmr_data(type = "country_region", silent = TRUE, cached = TRUE) df %>% dplyr::filter(iso3c == "USA") %>% dplyr::select(-iso3c) %>% dplyr::group_by(region) %>% dplyr::summarise(`Retail and Recreation Effect` = max(retail_recreation, na.rm = TRUE) - min(retail_recreation, na.rm = TRUE)) %>% dplyr::rename(`U.S. State` = region) %>% dplyr::arrange(-`Retail and Recreation Effect`)#> # A tibble: 51 × 2 #> `U.S. State` `Retail and Recreation Effect` #> <chr> <dbl> #> 1 South Dakota 140 #> 2 Maine 136 #> 3 Alaska 131 #> 4 Montana 125 #> 5 New Hampshire 125 #> 6 Wyoming 120 #> 7 Vermont 117 #> 8 West Virginia 117 #> 9 Idaho 115 #> 10 North Dakota 115 #> # ℹ 41 more rows