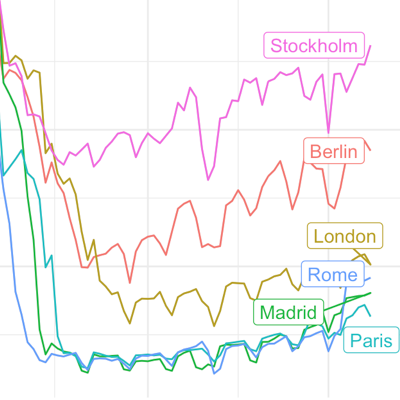
OK. We are at home. Again. Given that large parts of Europe and the U.S. are currently experiencing a second large wave of Covid-19 cases and that most European jurisdictions have reacted with more or less rigorous lockdown regulations, one wonders about the effects of these regulations on social distancing compared to the one in March/April. This graphical primer on this topic is the outcome of a recent data visualization workshop that we run for the TRR 266.
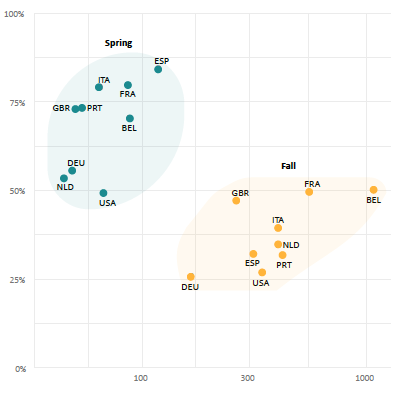
A recent update to the {tidycovid19} package brings data on testing, alternative case data, some regional data and proper data documentation. Using all this, you can use the package to explore the associations of (the lifting of) governmental measures, citizen behavior and the Covid-19 spread.
As the Covid-19 pandemic is affecting more and more countries around the globe, I included additional visualizations options into the {tidycovid19} package so that it becomes easier to compare the spread of the virus across countries. Also, I use this post to take a quick look on some countries that start lifting their governmental measures. See for yourself!