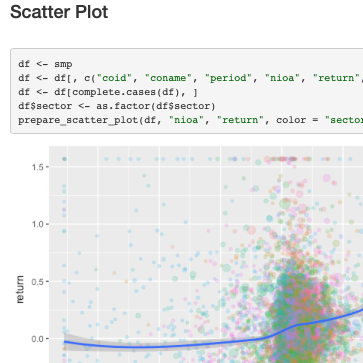
The new version of the ‘ExPanDaR’ package will include the option to export your explorative data analysis to an R Notebook. This Notebook can then be used to extend your analysis. Let me show you how to do this.
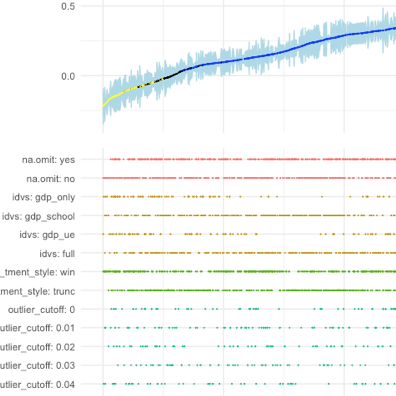
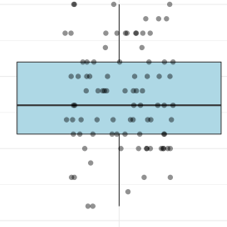
Following up on a recent blog article that discussed how to use R to explore your researcher degrees of freedom, this post introduces a specification curve plot as suggested in Simonsohn, Simmons and Nelson. With this plot, you can eyeball how various researcher degrees of freedom affect your main outcome of interest.
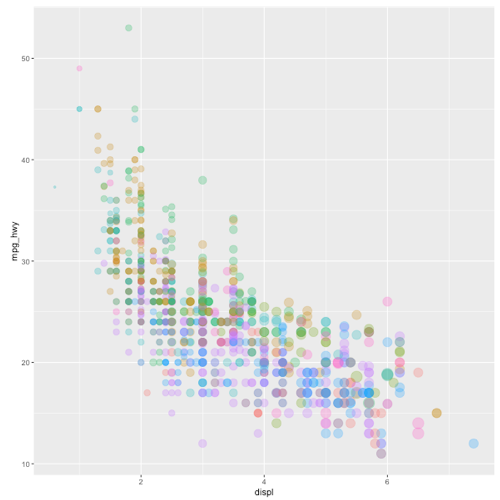
Interactive EDA is nice but customized interactive EDA is even nicer. To celebrate the new CRAN version of my ‘ExPanDaR’ package I prepare a customized variant of ‘ExPanD’ to explore the U.S. EPA data on fuel economy
Classroom experiments are a great way to communicate insights and shiny is a fantastic tool to develop interactive data displays. Linking the two together, you can build a unique experience for your students!
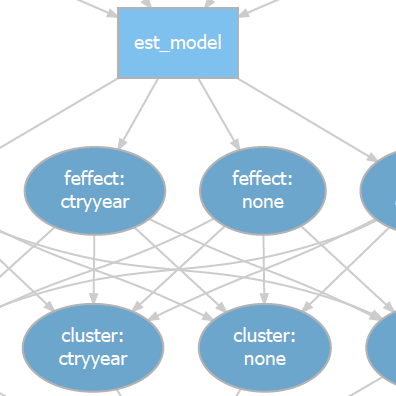
Researchers face many options when designing tests. The resulting researcher degrees of freedom are often not well documented in published work but highly influential for findings. My new in-development R package rdfanaylsis provides a coding framework to systematically document and explore the researcher degrees of freedom in research designs based on observational data.
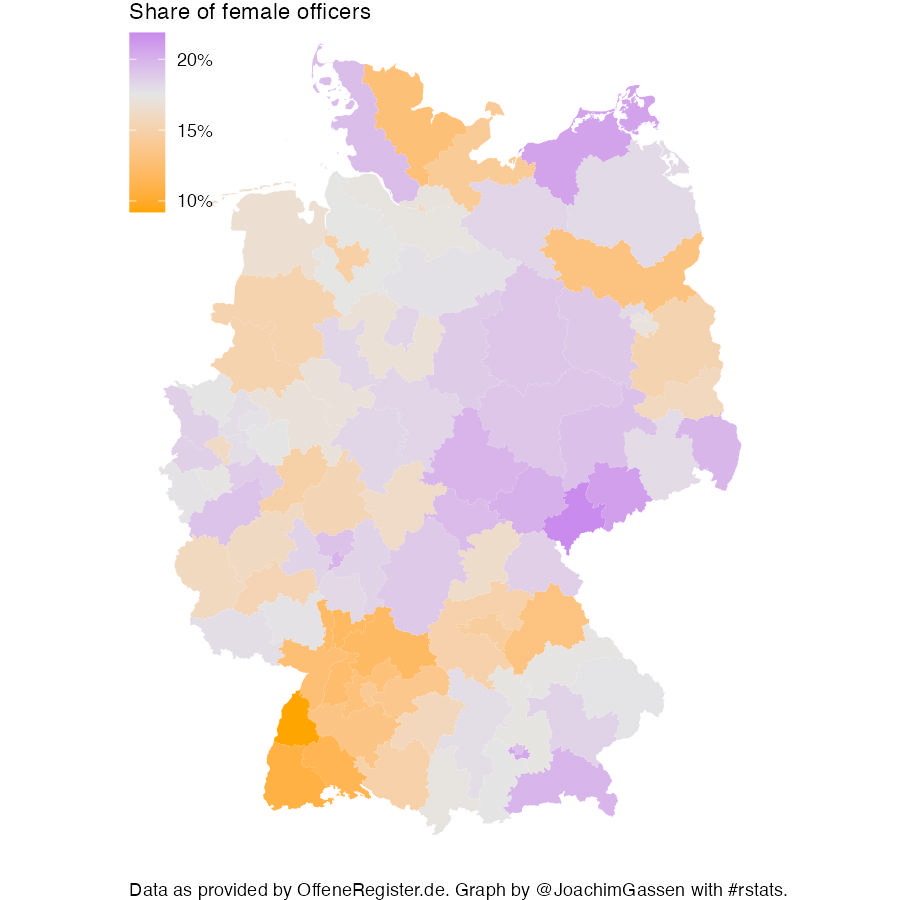
This a quick follow-up to my last post using German Trade Register data provided by offeneregister.de. This time I am picking up on an idea from Johannes Filter to locate female corporate officers.
The Project OffeneRegister.de has recently made German Trade Register data more accessible. Let’s see whether R can help us to learn where the German companies are.